Debugger#
Added in version 3.0.
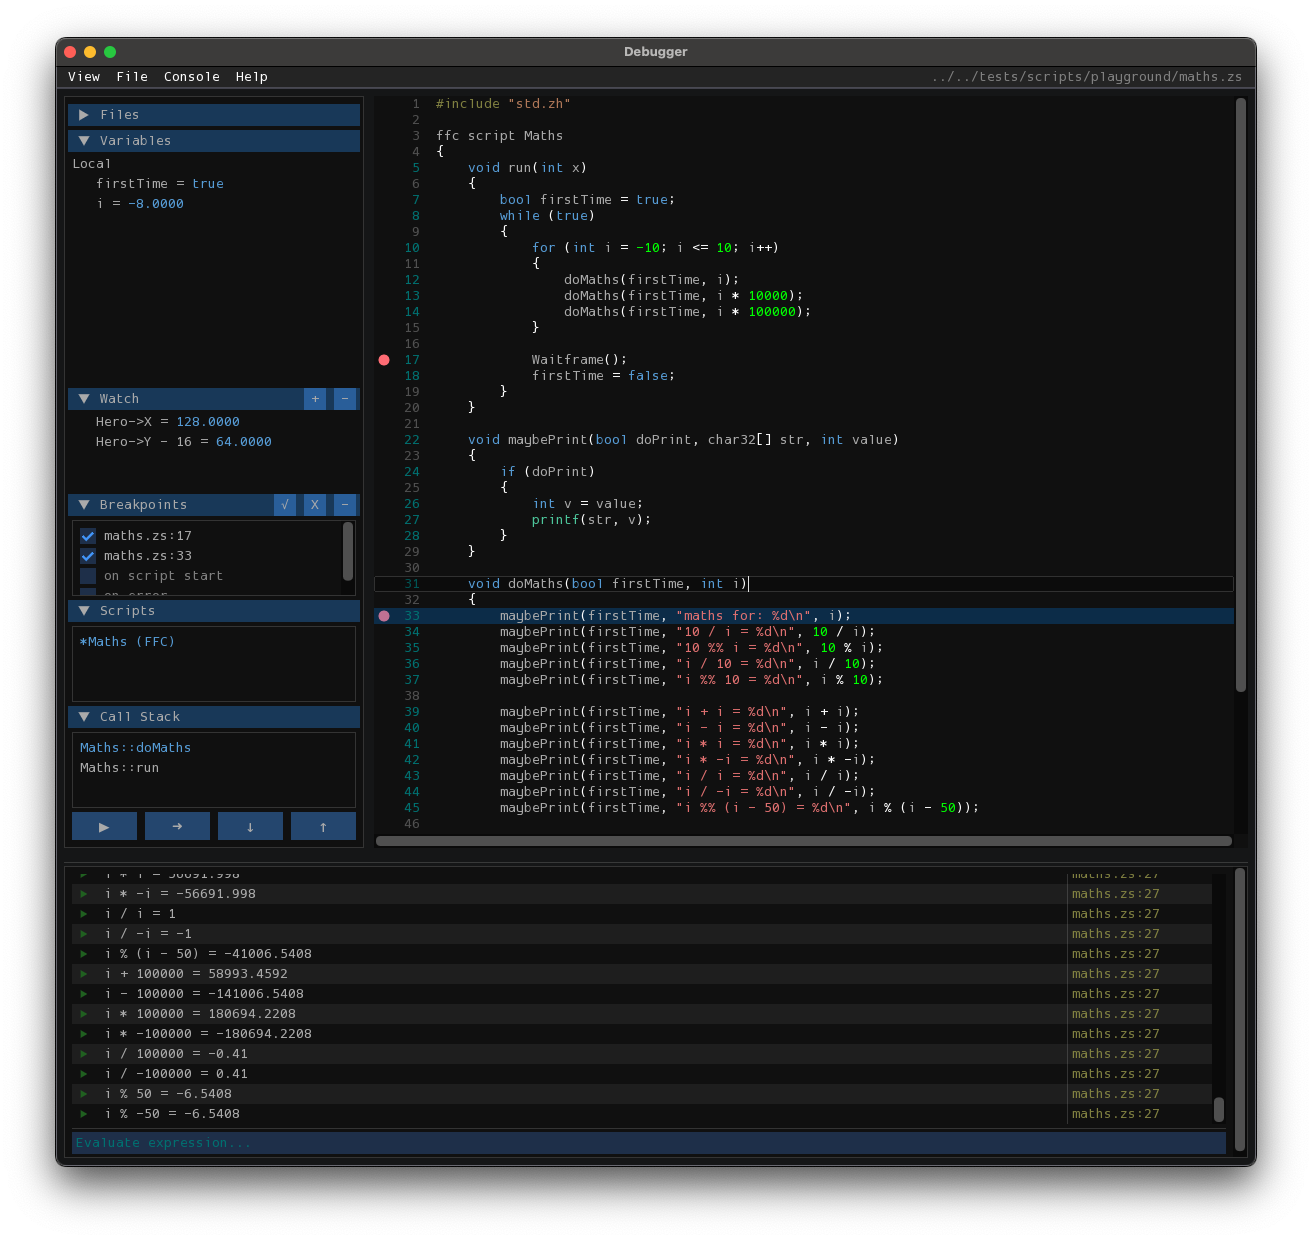
The ZScript debugger provides a fully integrated environment for inspecting and debugging scripts in real-time. It features a rich console, breakpoints, and advanced navigation tools.
This is currently not available in the web build.
Console & Evaluation#
The debug console allows for the evaluation of complex expressions during runtime. Objects and arrays returned by evaluations are fully interactive; you can expand them to inspect their properties, mirroring the behavior of the Variables view.
Rich Object Inspection: Evaluated objects are interactive. Click arrow icons to expand arrays or class instances.
Command History: Press
Up/Downwhile the input is focused to cycle through your command history.Auto-Scroll: The console automatically scrolls to keep the latest output and expanded objects in view.
Quick Open#
To quickly jump between source files, use the Quick Open dialog.
Shortcut: Press
Ctrl+P(orCmd+Pon macOS) to open the file selector.Fuzzy Matching: Type part of a filename (e.g.,
npc/zh) to find it instantly.Keyboard Navigation: Use
Up/Downto highlight a file andEnterto open it.
Debugger Controls#
The debugger supports standard keyboard shortcuts for controlling execution flow:
Shortcut |
Action |
|---|---|
|
Continue / Start (Resume execution) |
|
Pause (Break execution) |
|
Step Over (Execute next line) |
|
Step Into (Enter function call) |
|
Step Out (Return from current function) |
Breakpoints & Watch Window#
- Breakpoints
Instruct the program to pause at specific places.
In the script text view, left-click on the gutter (the area to the left of the line numbers) to toggle a breakpoint.
In the script text view, right-click to open the context menu: you can Add, Remove, or Toggle Disable/Enable breakpoints for specific lines.
Enable the
on script startspecial breakpoint to pause whenever a new script begins.Enable the
on errorspecial breakpoint to pause whenever an error occurs.
- Watch Window
Monitor specific variables or expressions over time.
Click the + button to add a new watch expression.
Use the context menu to Enable All, Disable All, or Clear All watch expressions.
Can also add a watch expression by right-clicking a variable in the Variables window or in the console
Profiling#
Added in version 3.0.
Not part of the debugger UI, but useful for debugging performance: the player can measure how much time your scripts spend in the scripting engine.
Launch the player with the -script-timings command line switch, play the quest, then quit. A summary is printed to the log (allegro.log, or the terminal):
Total time spent running scripts, and the number of times a script ran.
The highest-cost scripts, sorted by total time.
The slowest script-frames: the total time a single script spent inside one frame (an FFC or NPC script may run many times in a single frame; those are counted together). Shows the frame number, so you can correlate a spike with what was happening in the game. Configure how many are reported with
-script-timings-top <N>(default 20).
zplayer.exe -script-timings

# Or: load a screen in test mode: "-test qst dmap screen"
zplayer.exe -script-timings -test path/to/quest.qst 0 0
Example output:
=== script timings ===

run_script calls: 22018
total time in scripting engine: 903.9 ms
avg per call: 41.05 us

highest-cost scripts (top 16 of 16):

script                                         total (ms)      calls    avg (us)
global-1-GlobalScripts                              548.8       3946      139.08
generic-6-TempLinkState_Generic                     126.9       7017       18.09
dmapdata-7-ScriptedSubscreenComponents               66.4       1973       33.64
ffc-57-CapturedSequenceRightHand                     55.8       1562       35.71
subscreen (engine)-1-CyclableTriforceFrames          42.4        103      411.29
lweapon-8-CustomSparkle                              38.2        390       97.95
generic-3-HeroGotYeeted                              13.8       2340        5.92
generic-5-MinecartGeneric                            11.2       4678        2.40
ffc-8-ContinuePoint                                   0.2          2       84.13
global-4-OnLaunch                                     0.1          1       59.09
global-7-onSave                                       0.1          1       56.26
global-3-onSaveLoad                                   0.0          1       35.37
hero-1                                                0.0          1       32.16
generic-1-WindHandler                                 0.0          1       13.17
global-2-onExit                                       0.0          1       12.54
hero-2-HeroActive                                     0.0          1        4.68

slowest script-frames (top 20):

          ms      frame    calls   script
       47.69      48851        1   ffc-57-CapturedSequenceRightHand
       37.75      48751        2   global-1-GlobalScripts
       37.74      48617        1   subscreen (engine)-1-CyclableTriforceFrames
       37.73      48981        2   global-1-GlobalScripts
       37.72      49750        2   global-1-GlobalScripts
       37.70      48964        2   global-1-GlobalScripts
       37.70      48772        2   global-1-GlobalScripts
       37.68      48812        3   generic-6-TempLinkState_Generic
       37.67      49059        2   global-1-GlobalScripts
       37.66      49102        2   global-1-GlobalScripts
       37.65      48654        3   generic-6-TempLinkState_Generic
       37.64      50678        2   global-1-GlobalScripts
       37.63      48742        2   global-1-GlobalScripts
       37.60      49644        2   global-1-GlobalScripts
       37.60      49983        2   global-1-GlobalScripts
       37.57      49180        1   dmapdata-7-ScriptedSubscreenComponents
       37.57      50914        2   global-1-GlobalScripts
       37.55      50984        4   lweapon-8-CustomSparkle
       37.50      49527        3   generic-6-TempLinkState_Generic
        1.42      48442        2   global-1-GlobalScripts
This is rudimentary - it measures wall-clock time for whole scripts, not individual functions or lines. To dig deeper, a common trick is to comment out parts of a hot script and compare runs.
Iterating on a script’s performance#
To measure the impact of a change without playing through the quest by hand, record a replay of a representative section once, then repeat:
Modify your script.
Recompile the quest (close the editor first):
zeditor.exe -quick-assign path/to/quest.qst
Run the replay; the report prints when it finishes:
zplayer.exe -script-timings -replay path/to/replay.zplay -replay-exit-when-done -headless -v0
Compare the reports between runs.
As a rule of thumb - the game should run at a steady 60 FPS, so each frame has about 16.66 ms to run. The scripting engine is just one part of that, so any script that runs for more than a few ms in a single frame risks reducing the frame rate.